How to Maximize the Use of Chrome Dev Tools
You think you know Chrome Dev Tools - but if console.log didn't count, how well would you say you know all the remaining secrets?
This is a comprehensive tutorial on the complete feature set that Chrome DevTools provides in 2024. DevTools are primarily oriented for the development of web applications and given Chrome’s dominant market share adoption out of all the browsers, it makes sense to utilize its full potential in the development, debugging, testing, monitoring and maintenance of your applications.
You’ll find in this tutorial that there are many features that you were unaware of. While keeping this to a relatively long-length without converting it into a complete book or guide, decisions were made to summarize certain sections with more or less detail to include the basics, with examples, and allowing you to pursue further the topics of most interest to yourself.
Contents
Introduction to DevTools
Panels in Detail
Elements
Console
Recorder
Performance Insights
Sources
Network
Performance
Memory
Application
Security
Lighthouse
Introduction to DevTools
History of Chrome
Google Chrome is a web browser first released in 2008. At the time, Microsoft Explorer (yes, actually) dominated the landscape as Internet v2 emerged, with dynamic content and web applications. Recall that Facebook was founded just in 2004 and many of the subsequent years brought the growth of, both, the Internet web apps as well as the mobile ecosystem, with the release of the original iPhone in 2007.
Chrome DevTools
Chrome DevTools were released alongside the first version of Chrome - and as Chrome grew to better versions over the years, so did the DevTools.
Formally speaking, Chrome DevTools are just a set of tools built directly into the Google Chrome browser
These tools help you inspect, debug, and analyze the performance of your web applications
These tools are also organized into tabs alongside the top header and left and right menus, giving you complete control over the entire web experience
Opening Chrome DevTools
Three ways to open
Right-click on any webpage element and select "Inspect", or
Press Ctrl + Shift + I (Windows/Linux) or Cmd + Option + I (Mac), or
Press F12
Once you open the DevTools, you’ll most commonly see the default Elements tab open. To the right of it, you will also see all these other tabs, each with specific features. The subsequent parts of this blog focus on giving summaries of each of the tabs and its related feature set.
Menu
Elements
Console
Recorder
Performance Insights
Sources
Network
Performance
Memory
Application
Security
Lighthouse
Elements Panel
The Elements panel lets you inspect and modify the HTML and CSS of a webpage
Inspecting Elements
Use the cursor icon to select and inspect elements
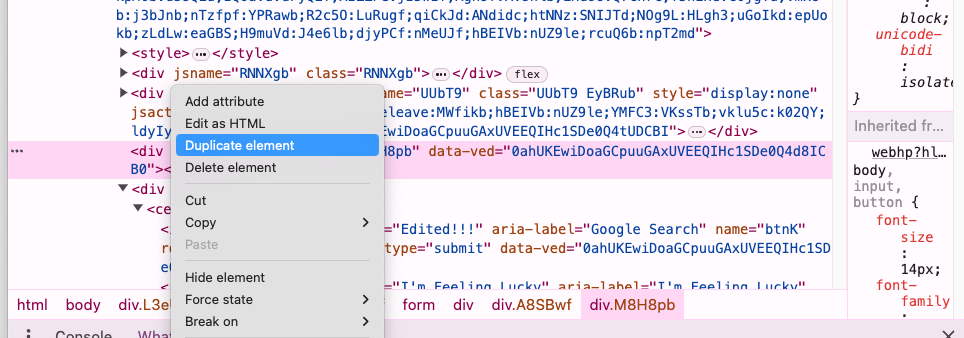
Modifying HTML
Double-click an element or right-click and select "Edit as HTML."
Editing CSS
Modify CSS properties in the Styles pane
You can add new properties and toggle existing ones
Inspect HTML elements and modify CSS for specific elements
Inspect and Edit Elements
Add / Delete / Modify / Duplicate Elements
Example Actions
Inspect a button on a webpage and change its text
Modify the background color of a div element
Console Panel
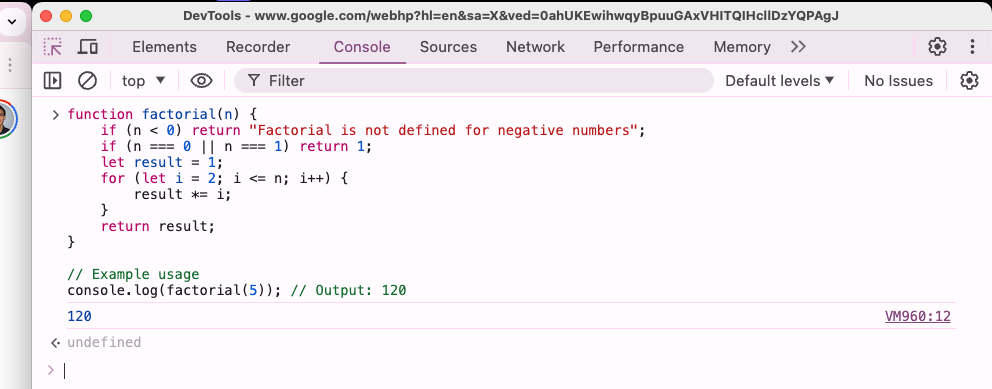
The Console panel allows you to log diagnostic information and interact with the JavaScript on the page
Logging Messages
Use console.log(), console.error(), console.warn(), etc
Running JavaScript
Execute JavaScript directly in the Console
Execute Console Commands
Execute Javascript Code on the Console
Example Actions
Log the value of a variable: console.log(variableName);
Run a function: myFunction();
Try running this yourself on your DevTools:
function sumTokens(tokens) {
    var result = 0;
    var prevSign = "+";
    for(let token of tokens) {
        const notNum = isNaN(token);
        const isNum = !notNum;
        if(isNum) {
            const asNum = Number(token);
            if(prevSign === "+") {
                result += asNum;
            }
            else {
                result -= asNum;
            }
        }
        else {
            prevSign = token;
        }
    }
    return result;
}
sumTokens(100);
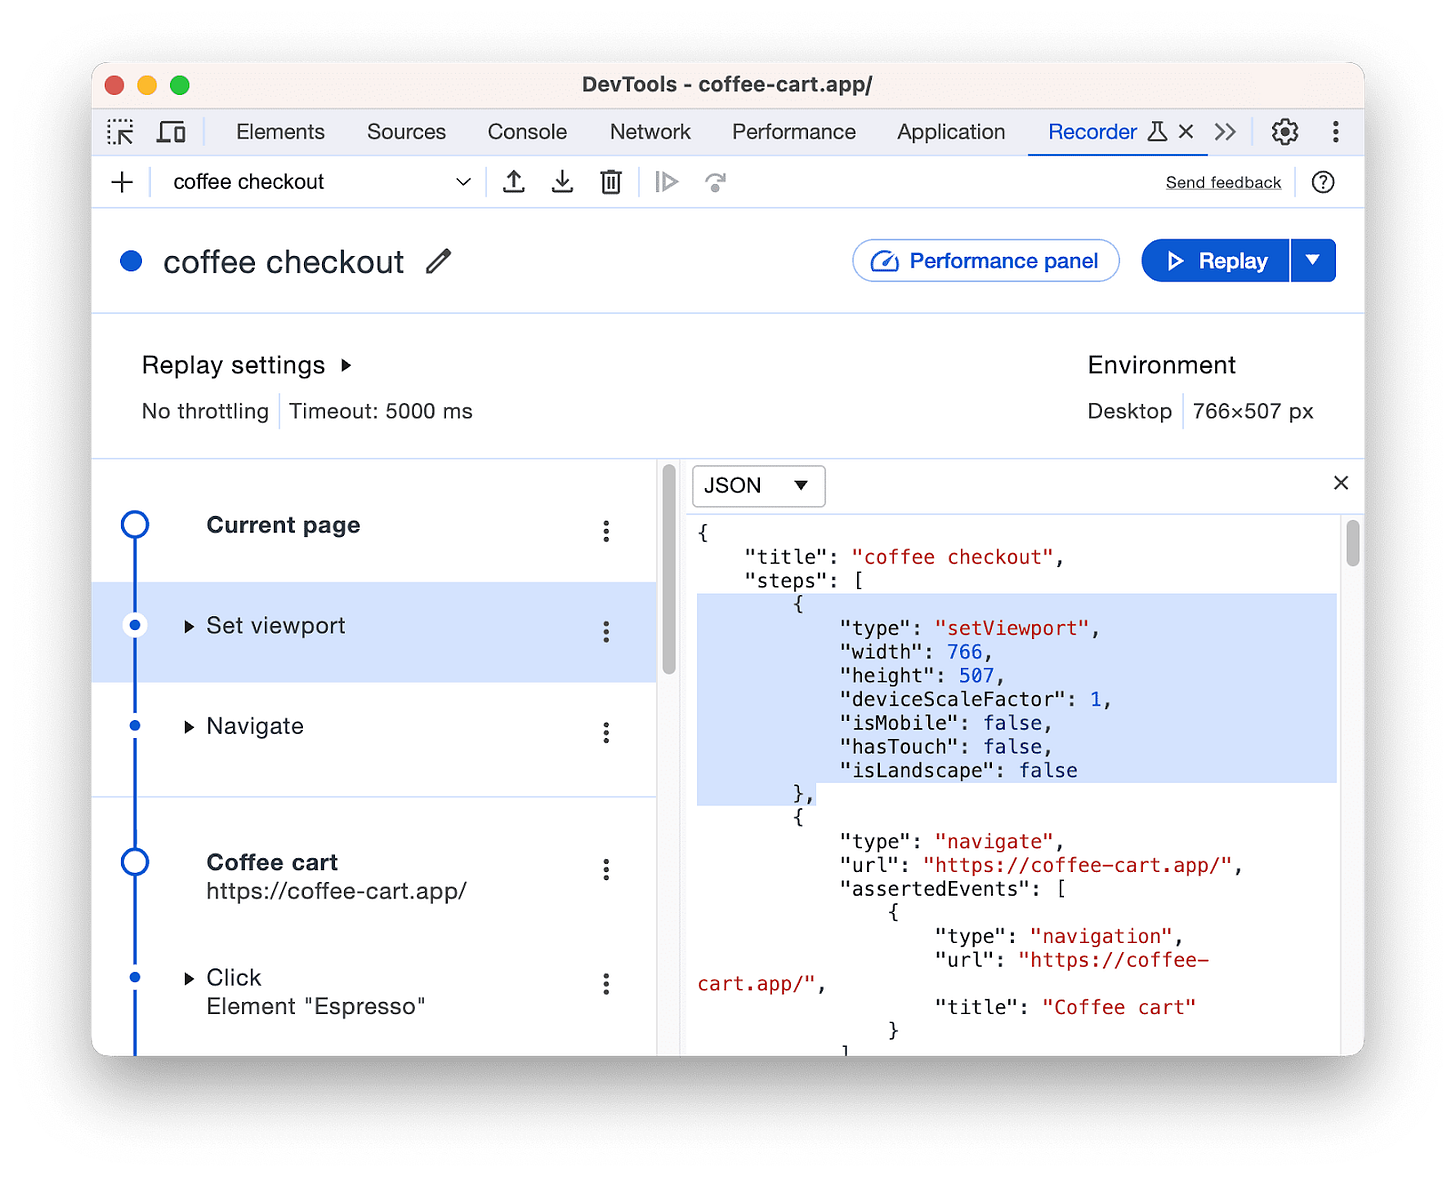
Recorder
Record, replay, measure user flows
Customize the Recorded extensions
Sources Panel
The Sources panel helps you debug JavaScript and view all the files associated with the webpage
Viewing Files
Browse and view the files loaded by the webpage
Setting Breakpoints
Click on the line number to set a breakpoint
Stepping Through Code
Use the controls to step through your code
Example Actions
Set a breakpoint in a JavaScript function and step through the code to see how it executes.
Network Panel
The Network panel shows all network requests made by the webpage and their details
Inspecting Requests
View details of each request, including headers, responses, and timing
Filtering Requests
Filter by type (e.g., XHR, JS, CSS)
Example Actions
Monitor the loading of a webpage and identify slow resources
Performance Panel
The Performance panel helps you analyze the runtime performance of your webpage
Recording a Performance Profile
Click the record button and interact with your page, then stop recording
Analyzing the Profile
View the CPU activity, frame rate, and more
Example Actions
Record and analyze the performance of a webpage during a user interaction
Memory Panel
The Memory panel helps you find memory leaks and optimize your webpage’s memory usage
Heap Snapshots
Take snapshots of the heap to analyze memory allocation
Allocation Instrumentation
Record JavaScript memory allocations over time
Example Actions
Take a heap snapshot and analyze objects that are taking up memory.
Take snapshots of what is taking up memory on a live website
Application Panel
The Application panel lets you inspect all the resources that are loaded into your web app.
Local Storage and Session Storage
View and modify key-value pairs
Cookies
Inspect and delete cookies
Service Workers
View registered service workers and their status
Caching vs Local Storage vs Session Storage vs Cookie | by supraja | Medium
Example Actions
Inspect local storage and add a new key-value pair.
Example of Adding a Session Storage Key-Value
Security Panel
The Security panel provides an overview of the security of your page
Inspect Security Information
View details about SSL certificates and mixed content
Security Issues
Identify and troubleshoot security issues
View the Security Information for a Page, Domain and Connection
View Certificate
Example Actions
Check the security state of your webpage and identify mixed content warnings
Lighthouse Panel
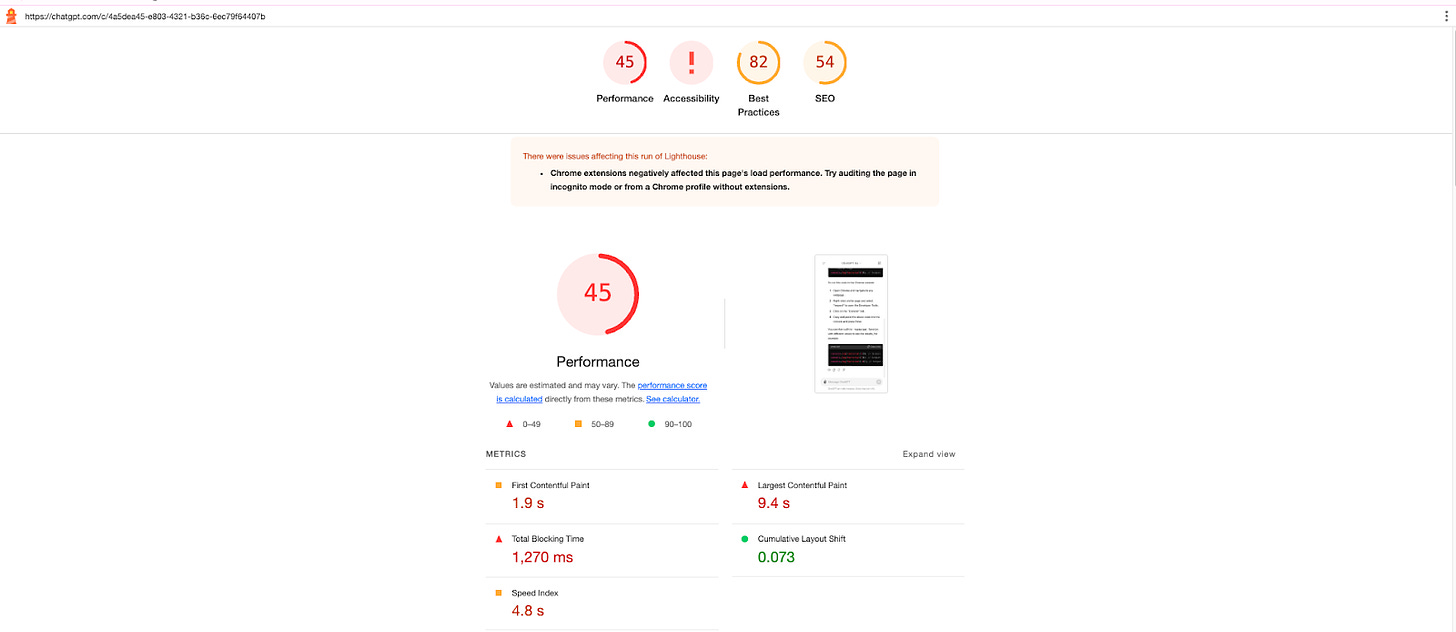
The Lighthouse panel helps you run audits on your webpage for performance, accessibility, best practices, and SEO.
Running an Audit
Click "Generate report" to run an audit on the current page
Viewing Results
Inspect the results and recommendations for improvements
Example Actions
Run a Lighthouse audit on your webpage and review the performance and accessibility recommendations.
Lighthouse Audit
Lighthouse Audit Results
Accessibility Panel
The Accessibility panel helps you inspect the accessibility properties of your webpage elements
Inspecting Elements
View the accessibility properties such as ARIA attributes and roles
Color Contrast
Check the color contrast of elements
Example Actions
Inspect an element and review its ARIA attributes to ensure it’s accessible.
Example Workflow
It’s a lot of tools - and the reality is that you’ll only use 1 or 2 of them initially and for most of your beginner and intermediate journey. It is only if you start specializing in the development of performant web applications that you’ll slowly pick up other tools to investigate the key elements of your web app to attend to different ways of how to improve of load time, speed, responsiveness and other key features.
Go-Tos
A common workflow of how a typical user might use the DevTools would be as follows:
Inspect and Modify Elements
Use the Elements panel to inspect and make changes to the HTML and CSS of a page
Debug JavaScript
Set breakpoints in the Sources panel and step through your JavaScript code
Monitor Network Activity
Use the Network panel to monitor and analyze network requests
Optimize Performance
Record a performance profile and analyze it in the Performance panel
Check Memory Usage
Take a heap snapshot in the Memory panel and analyze memory allocations
Audit Your Page
Run a Lighthouse audit to get performance and accessibility recommendations


